
Candlesticks Patterns in Detail
Technical analysis builds upon basic concepts of charts and indicators by introducing a wider array of patterns, risk management strategies, and combining different tools for trade confirmation.
Key Components of candlestick pattern in Technical Analysis
Intermediate techniques focus on a more nuanced interpretation of market dynamics, moving beyond simple trend following to anticipate potential shifts and improve trade timing.
Candlestick patterns provide visual cues about price movements and market sentiment. They are broadly categorized into reversal, continuation, and indecision patterns.
- Candlestick Pattern Table
| Pattern Name | Type | Visual Description | Market Interpretation |
| Hammer | Bullish Reversal | Small body at the top, long lower wick (at least 2x body size), little/no upper wick. | Rejection of lower prices; bulls regaining control after a downtrend. |
| Hanging Man | Bearish Reversal | Same shape as the Hammer, but appears after an uptrend. | Selling pressure emerging; warning that the uptrend might be over. |
| Inverted Hammer | Bullish Reversal | Small body at the bottom, long upper wick, little/no lower wick. | Buyers are testing higher prices; potential for a bullish reversal. |
| Shooting Star | Bearish Reversal | Same shape as the Inverted Hammer, but appears after an uptrend. | Strong rejection of higher prices; potential for a bearish reversal. |
| Bullish Engulfing | Bullish Reversal | Large green candle body completely covers the preceding small red candle body. | Strong indication that bulls have taken full control. |
| Bearish Engulfing | Bearish Reversal | Large red candle body completely covers the preceding small green candle body. | Strong indication that bears have taken full control. |
| Doji | Indecision | Open and close prices are virtually the same (looks like a cross or plus sign). | Market indecision; often signals a major turning point after a long trend. |
| Morning Star | Bullish Reversal | A long red candle, followed by a small-bodied candle, and a long green candle. | Signals the end of a downtrend and the start of an uptrend. |
| Evening Star | Bearish Reversal | A long green candle, followed by a small-bodied candle, and a long red candle. | Signals the end of an uptrend and the start of a downtrend. |
| Piercing Line | Bullish Reversal | A red candle followed by a green candle that opens lower but closes more than halfway into the red body. | Strong buying interest after initial drop; potential bullish reversal. |
| Dark Cloud Cover | Bearish Reversal | A green candle followed by a red candle that opens higher but closes below the midpoint of the green body. | Strong selling interest after initial rise; potential bearish reversal. |
| Doji (Dragonfly/Gravestone) | Reversal/Indecision | Dragonfly has a long bottom wick; Gravestone has a long top wick. | Rejection of one extreme (lows for Dragonfly, highs for Gravestone). |
| Spinning Top | Indecision | Small body with roughly equal length upper and lower wicks. | Balance between buyers and sellers; often found during consolidation periods. |
| Rising/Falling Three Methods | Continuation | A large trend candle, followed by several small counter-trend candles within the range, and a final large trend candle. | Temporary pause in the existing trend before resuming. |
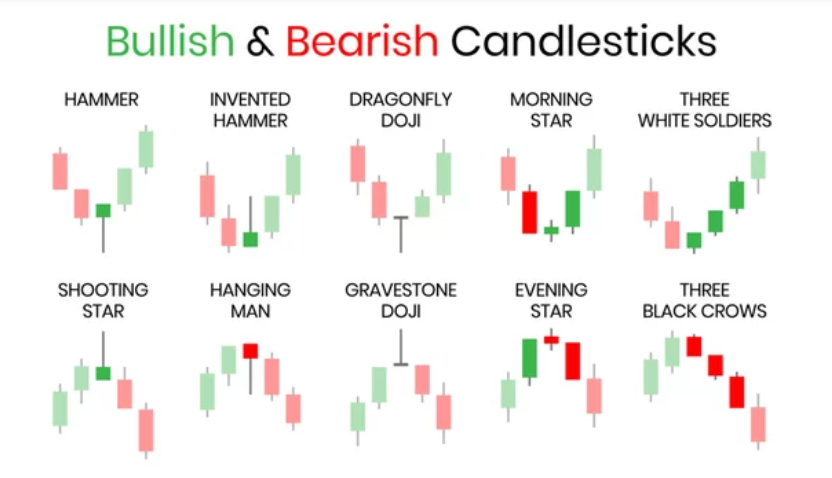
Chart Patterns (More Complex)
Intermediate analysis incorporates more complex geometric patterns that forecast larger market movements.
- Wedges (Rising/Falling): Similar to triangles but typically signal reversals rather than continuations. A falling wedge is generally bullish, while a rising wedge is bearish.
- Flags and Pennants: Short-term consolidation patterns that appear as small rectangles or triangles within a strong trend, typically leading to a continuation of the primary trend after a breakout.
- Channels: Drawing parallel trendlines around price action to define a clear path of movement. Trading within a channel involves buying near the support line and selling near the resistance line.
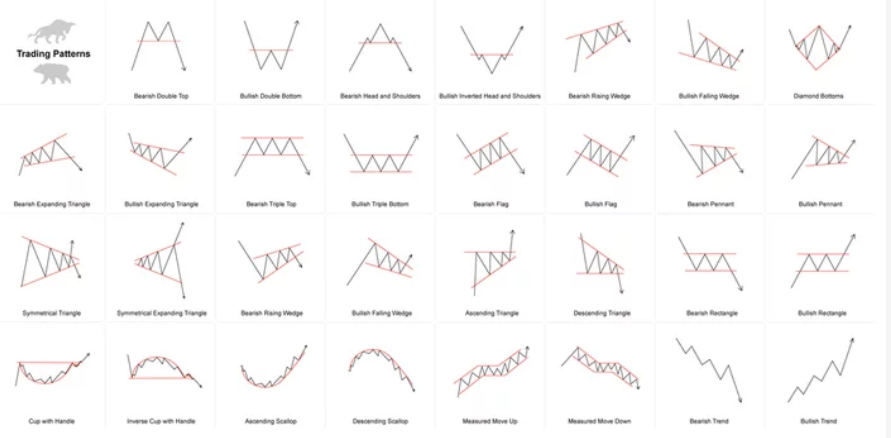
Chart patterns in technical analysis are graphical formations that represent market sentiment and potential price direction. They are broadly categorized as reversal (trend change), continuation (trend resume), or bilateral (move in either direction).
- Technical Analysis Chart Patterns
| Pattern Name | Category | Market Signal | Visual Shape Description |
| Head and Shoulders | Reversal | Bearish (Downtrend) | Three peaks; middle (head) is highest, two outer (shoulders) are lower. |
| Inverse Head & Shoulders | Reversal | Bullish (Uptrend) | Three troughs; middle is deepest, outer two are shallower. |
| Double Top | Reversal | Bearish (Downtrend) | Two consecutive peaks at roughly the same price level (“M” shape). |
| Double Bottom | Reversal | Bullish (Uptrend) | Two consecutive lows at roughly the same price level (“W” shape). |
| Cup and Handle | Continuation | Bullish (Uptrend) | A rounded “U” shape followed by a small downward-sloping consolidation (the handle). |
| Bullish Flag | Continuation | Bullish (Uptrend) | Sharp upward “pole” followed by a small, downward-sloping parallel rectangle. |
| Bearish Flag | Continuation | Bearish (Downtrend) | Sharp downward “pole” followed by a small, upward-sloping parallel rectangle. |
| Ascending Triangle | Continuation | Bullish (Uptrend) | Flat top resistance line and an upward-sloping support line. |
| Descending Triangle | Continuation | Bearish (Downtrend) | Flat bottom support line and a downward-sloping resistance line. |
| Symmetrical Triangle | Bilateral | Either Direction | Two converging trend lines (lower highs and higher lows) meeting at a point. |
| Rising Wedge | Reversal | Bearish (Downtrend) | Two upward-slanting trend lines where support is steeper than resistance. |
| Falling Wedge | Reversal | Bullish (Uptrend) | Two downward-slanting trend lines where resistance is steeper than support. |
| Pennant | Continuation | Trend Direction | Small symmetrical triangle forming after a sharp price movement. |
| Rounding Bottom | Reversal | Bullish (Uptrend) | Price gradually forms a wide, curved “bowl” shape over time. |
Intermediate traders learn to combine multiple indicators to confirm signals and filter out noise, avoiding reliance on a single tool.
There are hundreds of technical indicators, which are mathematical calculations based on a security’s price, volume, or open interest. They are primarily used to forecast future price movements and provide insights into supply and demand dynamics.
Here are some of the most widely recognized and frequently used indicator categories and names:
Trend Indicators
These indicators help determine the direction of the market and filter out noise.
- Moving Averages (MA): The most basic and common indicator. It smooths price data to identify the trend direction.
- Simple Moving Average (SMA)
- Exponential Moving Average (EMA) (Gives more weight to recent data)
- MACD (Moving Average Convergence Divergence): Shows the relationship between two moving averages and can identify trend strength and potential reversal points.
- ADX (Average Directional Index): Measures the strength of a trend, not the direction.
Momentum Indicators
These indicators help identify overbought and oversold conditions, and the speed of price changes.
- RSI (Relative Strength Index): A scale from 0 to 100 used to determine if a stock is overbought (above 70) or oversold (below 30).
- Stochastic Oscillator: Similar to RSI, but it compares a closing price to its price range over a period.
- CCI (Commodity Channel Index): Identifies cyclically overbought and oversold levels.
Volatility Indicators
These tools measure how much the price of an asset fluctuates.
- Bollinger Bands: Consists of a middle moving average and two outer bands that expand and contract with volatility.
- ATR (Average True Range): Measures market volatility by averaging the true range of an asset’s price movements.
Volume Indicators
These help confirm the strength of price movements by analyzing trading volume.
- Volume Weighted Average Price (VWAP): A trading benchmark often used by institutional traders that provides the average price at which a stock has traded throughout the day, weighted by volume.
- Chaikin Money Flow (CMF): Measures the flow of money in or out of a security.
- Moving Average Convergence Divergence (MACD): While a common indicator, intermediate use involves looking for divergence between the price action and the MACD lines (e.g., price makes a lower low, but MACD makes a higher low, signaling a potential reversal.)
- Relative Strength Index (RSI): Used to identify overbought (>70) and oversold (<30) conditions. Intermediate traders also use RSI to spot divergence and plot trendlines on the indicator itself.
- Stochastics Oscillator: Similar to RSI, this momentum indicator can be used in conjunction with RSI for confirmation of overbought/oversold signals or divergence.
Risk Management and Trade Management
- A crucial aspect of intermediate analysis is a formalized approach to managing risk, which is often missing at the beginner level.
- Position Sizing: Calculating the appropriate number of shares or contracts to trade based on risk tolerance and account size.
- Stop Losses and Take Profits: Placing orders to automatically exit a trade when a certain loss threshold or profit target is reached.
Risk-to-Reward Ratio: Only taking trades where the potential profit significantly outweighs the potential loss (commonly aiming for a 2:1 ratio or better).
Disclaimer: I am not a SEBI registered investment advisor. The content in this article is for educational purposes only and should not be considered financial advice. While we strive for accuracy, the information and data mentioned may vary, and human error is possible. Please consult your financial advisor before making any investment decisions.