
Quarterly Results: Beyond the Numbers
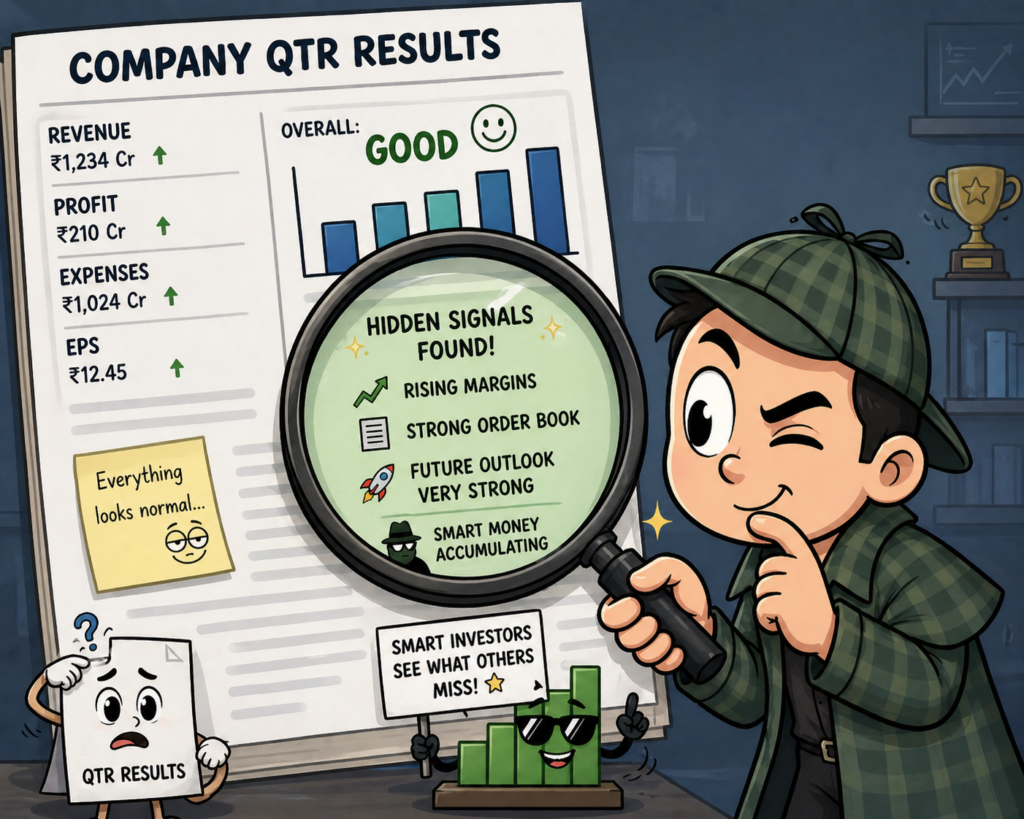
Quarterly earnings arrive, and suddenly the world discovers a fresh passion for balance sheets. Overnight, timelines are flooded with deep insights and interpretations of numbers most people ignored three days ago. The same balance sheet that was collecting dust all quarter now becomes prime-time entertainment.
Now, I do the same and open the report adjust my glasses, nod seriously at debt-to-equity, mumble something about working capital but evaluating the balance sheet is not my intention here. There are already many intellectual, highly qualified, registered analysts who do that job exceptionally well.
My goal is trying to highlight the hidden signals that many people overlook.
That includes:
- Hidden messages in company concalls and announcements
- Hidden balance sheet clues beyond profit, loss, and EPS
- Hidden behaviour of promotor/FIIs/DIIs
- Hidden technical signals in price and volume action
Company concalls and announcements often carry hidden commentary.
- The real message is not only in the words, but in tone, confidence, hesitation, and what is left unsaid.
- A confident management sounds clear and direct. Guidance is specific, answers are crisp, and execution commentary feels natural.
- A defensive management sounds different. Answers become lengthy, difficult questions are diverted, and familiar promises are repeated again and again.
- Sometimes silence says more than statements. If management avoids talking about margins, debt, demand slowdown, or cash flow, it can be a signal itself.
- Announcements also have layers. New orders, capex plans, acquisitions, promoter stake changes, pledge release, board exits, export wins, or restructuring updates all need deeper reading.
- Headline is public, interpretation is edge. Everyone reads the announcement. Few understand what it may mean 2–4 quarters ahead.
Balance Sheet Red Flags in Simple Language: Hidden Signs Most Investors Miss
- Cash vs reported profit: If profit rises but cash flow stays weak, quality of earnings may be questionable. Profit on paper, cash absent.
- Receivables rising faster than sales: Company may be booking revenue but struggling to collect money. Hidden stress in customers or aggressive accounting.
- Inventory building up unusually: Demand slowdown, unsold stock, wrong forecasting, or channel stuffing can hide here. Sometimes future write-down risk.
- Debt rising while profits look stable: Business may be using borrowings to maintain growth. Surface looks fine, foundation weakens.
- Contingent liabilities: Often ignored footnote. Legal disputes, guarantees, tax claims can become future cash outflow.
- Promoter pledging (if disclosed elsewhere with BS context): Can indicate leverage stress around ownership structure.
- Capital work-in-progress (CWIP): Large CWIP means expansion underway—but delays, cost overruns, or no returns can become issue.
- Other current assets / other assets growing fast: Sometimes legitimate, sometimes needs scrutiny. Hidden items can mask stress.
- Trade payables rising sharply: Company delaying supplier payments to preserve cash. Working capital pressure possible.
- Frequent equity dilution: Growth funded by issuing shares repeatedly can dilute owners instead of generating internal cash.
- Goodwill / intangible assets swelling after acquisitions: Risk of overpaying for deals. Future impairment possible.
- Return ratios vs asset growth mismatch: Assets increasing but ROCE/ROA falling can mean inefficient expansion.
Simple truth: Profit & Loss shows the story. Balance sheet tells whether the story is real or fake.
After the results, the chart becomes even more honest. It shows whether the market truly liked the earnings or merely pretended to for one day. A “good result” with a weak chart can expose disappointment hidden behind headlines. A stock rising after average numbers can signal that the future matters more than the quarter gone by.
Promoter, FIIs, and DIIs behaviour
- Promoter buying is the strongest internal signal. Management knows demand trends, order pipeline, margin pressure, and business reality better than outside investors. If they buy in weakness, it may reflect confidence in future value.
- FII buying during declines can signal long-term opportunity hunting. Foreign funds often use corrections to build positions gradually when valuations become attractive.
- DII buying in weak phases can indicate domestic conviction. Mutual funds, insurance funds, and pension money may accumulate when they believe earnings visibility remains intact.
If all three are buying while stock falls, market may be transferring shares from weak hands to strong hands. Retail panic sells, stronger capital absorbs supply. Before results, such buying can hint expectations are better than market mood. Institutions may anticipate earnings resilience, guidance improvement, or future triggers. After results, continued buying despite volatility can be more powerful. It suggests they are reacting to deeper commentary, not just headline EPS numbers.
In bear markets, these signals become more valuable. Strong hands buying when sentiment is poor often creates future leaders for the next cycle. In sideways markets, accumulation can stay hidden for months. Price may move nowhere, but shareholding patterns quietly improve before breakout.
context matters. If buying is tiny, symbolic, or one-off, it may mean little. Real signal is repeated accumulation with meaningful size.
Best setup: Falling or sideways stock + promoter/FII/DII accumulation + improving chart structure + earnings stability. That combination can precede rerating and vice- versa.
Price is visible. Ownership change is often invisible. Smart investors track both.
Charts often reflect how serious participants decode that hidden commentary. If institutions sense improving business momentum, you may see silent accumulation, higher lows, volume expansion, and relative strength before the crowd understands why. If smart money detects stress behind polished language, the chart may weaken despite “positive” announcements.
When a Chart Hints Something Big Is Brewing
Before quarterly earnings, price action can quietly hint at changing expectations. Unusual volume, steady accumulation, sudden relative strength, or silent breakouts sometimes suggest that informed money is positioning early. The numbers may not be public yet, but the market often starts sensing something before the official PDF lands.
What Price Movement Before and After Results Really Means
Sudden Fall Before Results
A sharp fall before results often means the market fears weak earnings, lower margins, poor guidance, or hidden negatives. Sometimes it is informed selling, sometimes rumours, sometimes traders reducing risk. If the fall comes with heavy volume, it matters more. Low-volume falls can be noise.
Sometimes it is also stop-loss hunting before volatility.
Sudden Rise Before Result
A sharp rise before results usually means the market expects a positive surprise—strong profit, better margins, good guidance, or sector tailwinds.
It may be early positioning by smart money, but sometimes just speculation.
If the rise comes with strong volume, conviction is higher.
Important Truth
Not every move means insider knowledge. Many traders simply react to:
- sector trends
- commodity prices
- management history
- chart patterns
- expectations
After Results: Opposite Reactions Happen
- Stock rises before results, then falls after good numbers = good news already priced in.
- Stock falls before results, then rises after average numbers = fear was excessive.
When Stock Barely Moves After Results
No movement often means results matched expectations.
The market saw nothing surprising enough to buy aggressively or sell heavily.
It can mean:
- numbers already known
- business outlook unchanged
- no hidden damage
- institutions quietly holding
Sometimes no reaction is the best reaction. Best Way to Read Price Action. Never judge only by price move.
Use this combination:
Price + Volume + Sector Trend + Valuation + Management Credibility
One signal alone is incomplete.
I really respect charts. Conference call speaks in words. Announcement speaks in headlines. Chart speaks in money and money usually listens carefully.
They simply reflect conviction, fear, greed, and expectations in real time. I am a strong believer that the chart often knows everything before the headlines do—and keeps revealing the truth long after the results are announced.
I’m not saying charts speak everything, and I’m definitely not saying balance sheets mean nothing. Both matter—just in different ways.
One tells you how investors are reacting. The other tells you what they are reacting to. Sometimes charts move before numbers. Sometimes balance sheets explain why charts moved later.
Smart investing is not choosing one side. It is using both together.
Chart without fundamentals can become speculation. Fundamentals without chart can become dead money for long periods.
Best approach: Use balance sheet to find quality and hidden clues, and chart to find timing.
Disclaimer: No offence is intended toward any company, individual, institution, analyst, or regulatory body mentioned in this article. The views expressed are purely personal opinions for educational and informational purposes only. I am not SEBI registered and this content should not be construed as investment, financial, legal, or trading advice. Stock market investments are subject to market risks, and readers should conduct their own research and consult a SEBI-registered financial advisor before making any investment decisions. The author shall not be responsible for any losses arising from the use of this content.