
Price Is the Last Thing to Move
A Framework for Reading Volume Before Price Moves
In FY2023, 71% of retail traders incurred losses in India’s intraday equity cash segment — up from 65% just four years prior. The market had recovered strongly from COVID lows. Participation was rising. Losses were rising faster. The cause is not complexity. It is sequence. Most participants read the market’s conclusion — price — while the argument that produced it — volume — goes entirely unread.
This article is about reading the argument first.
The Four Conversations Volume Has With Price
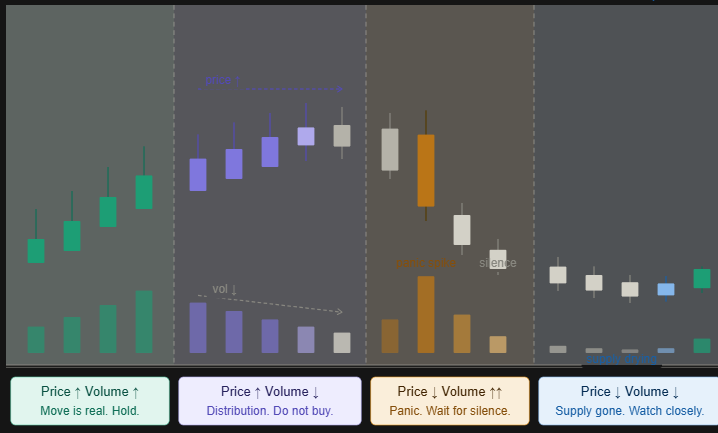
Price and volume run in parallel on every chart, every session. They agree. They diverge. They confirm. They contradict. Each combination describes a specific state of the market. Reading all four is the magnifying glass.
Conversation 1 — Confirmation: Price Up, Volume Up
The move is structurally sound. Participation is growing and conviction is deepening simultaneously. This is the only configuration where price and volume tell the same story. Nothing is hidden. The market is working exactly as it should.
Conversation 2 — The Transfer: Price Up, Volume Down
The rally is running on diminishing fuel. Each successive high is made by fewer, less committed participants. The chart looks healthy. The volume structure does not. Large participants are exiting into retail demand. Price stays elevated because buyers keep arriving — but conviction behind each transaction is shrinking. A rising price on falling volume is not a trend. It is a transfer.
Conversation 3 — Exhaustion: Price Down, Volume Surging
The market is in panic. Holders who cannot sustain psychological pressure are liquidating. The surge itself is not immediately actionable — it must exhaust first. The session to watch is the one that follows: a new price low on a fraction of the panic volume signals that sellers have run out of sellers. That silence is structural, not incidental.
Conversation 4 — The Setup: Price Down, Volume Down
Motivated selling has ended. Remaining holders are not selling at current prices. Supply is becoming scarce. This configuration precedes reversals more consistently than any price pattern — precisely because it looks like continued weakness to anyone watching only the candle. The volume is already telling a different story.
| A rising price on falling volume is not a trend. It is a transfer. A falling price on falling volume is not weakness continuing. It is weakness exhausting itself. |
The Tools That Partially Read These Conversations
Six indicators exist to translate price-volume relationships into signals. Each solves part of the problem. Each has a specific, documented gap.
| On-Balance Volume | Adds full session volume on up-days, subtracts on down-days. Good for catching multi-week accumulation phases. Gap: Treats every up-day identically regardless of where the close sits in the range. One engineered green candle permanently skews the reading. |
| VWAP | Average price at which shares changed hands, weighted by transaction size. The institutional execution benchmark. Gap: Resets daily. Says nothing about whether transactions were accumulation or distribution. |
| Volume Profile | Maps historical volume at specific price levels. Identifies High Volume Nodes as genuine support/resistance zones. Gap: Purely retrospective. Cannot tell you whether activity at those levels was buying or selling, or what participants intend when price returns. |
| A/D Line | Improves on OBV by weighting volume contribution based on where the close sits within the session’s high-low range. Closing near high = accumulation. Closing near low = distribution. Gap: Cannot separate genuine overnight delivery from intraday turnover that reversed before close. |
| Chaikin Money Flow | 21-day oscillator. Above zero = net accumulation. Above +0.25 = strong institutional buying. Below −0.25 = heavy distribution. More actionable than the A/D Line for shorter timeframes. Gap: A single anomalous high-volume session distorts the reading for the full look-back window. |
| Money Flow Index | RSI with volume weighting. Uses typical price (avg of high, low, close). Above 80 = overbought with strong inflow. Below 20 = oversold with outflow. More sensitive at extremes than CMF. Gap: Still works only with two variables — price and traded volume. The third variable does not exist in global market data. |
| Every one of these tools works with two variables. In global markets, two variables are all that exist. In Indian equity markets, a third variable is published publicly every evening. Not one of these tools uses it. |
Why This Variable Does Not Exist Anywhere Else
The NSE’s daily delivery disclosure is structurally unique. The New York Stock Exchange and NASDAQ publish price and total traded volume per security — nothing beyond that at retail-accessible granularity. The SEC publishes Failure to Deliver data, but only for settlement failures, only in aggregate, and with a two-week lag. The London Stock Exchange and European exchanges operating under MiFID II require transaction reporting, but per-security daily delivery counts are not available in any free public file. The Tokyo Stock Exchange publishes margin trading ratios as a proxy for directional sentiment, but raw settlement counts per stock per day do not exist in a retail-accessible format. Hong Kong’s HKEX publishes short-selling data but not full delivery breakdowns.
In every major global market, retail participants work with price and traded volume — two variables — because that is all the exchange makes available in real time, for free, at per-security granularity.
NSE publishes the Security-wise Deliverable Position file every trading day, for every listed security, freely, after market close. It is not a derived metric, a ratio, or an estimate. It is the raw settlement record of the day. No equivalent exists on any other major exchange at this accessibility level. This is not a marginal analytical advantage. It is a structural information asymmetry that most Indian retail participants are not using.
The Third Variable: What No Global Tool Sees
Every evening NSE publishes the bhav copy — the official record of the day: OHLC, volume, trades, and deliverable quantity for every listed security. Almost every EOD screener, chart, and stock page in India is built on this one file.
The deliverable quantity column is a raw count of shares that settled permanently into investor Demat accounts — held overnight, owned genuinely, appearing in the next shareholding disclosure. This is absolute delivery volume.
Most retail tools work with delivery percentage — the fraction of total traded volume that resulted in actual delivery. This is where the analytical error enters.
On a high-velocity session — when a stock moves sharply on three to five times its average volume — intraday participants flood the tape. Total traded volume explodes. Because delivery is measured as a fraction of that total, the delivery percentage collapses. Screeners flag weak delivery. The stock is dismissed. But the absolute delivery count — the raw numerator — may be running at two to three times normal. The denominator inflated. The numerator is being hidden by the denominator.
| The real signal is the numerator. Delivery percentage tells you the fraction. Absolute delivery volume tells you how many shares actually changed hands for real. |
Dixon Technologies (NSE: DIXON) — June to July 2026
Dixon Technologies provides the cleanest documented sequence in recent NSE cash market data. Every number below is sourced from MarketsMojo market data reports and Business Standard, drawn from NSE bhav copy disclosures. No derivatives data is used.
Signal One — 15 June 2026
Total traded volume: 2,23,874 shares. Day gain: 1.03%. Absolute delivery volume: 2.86 lakh shares — a 149% increase over the five-day average. Price barely moved. Total turnover was unremarkable. A percentage-based screener would have shown nothing unusual — because the delivery percentage, computed against that day’s total turnover, appeared ordinary. But 2.86 lakh shares were settling into demat accounts that would hold them overnight, running at 2.5 times the stock’s normal delivery baseline. The bhav copy recorded it. Standard screens missed it entirely.
Signal Two — 6 July 2026
Absolute delivery volume: 4.66 lakh shares — a 238% increase over the five-day average. Same session, Dixon gained 5.09%, outperforming the Consumer Durables-Electronics sector’s 3.85% gain and the Sensex’s 0.76% rise. Over the following five sessions, the stock accumulated a 10.83% return on sustained buying rather than a single spike.
| Mid-June: absolute delivery surges 149%, price moves 1%. Three weeks later: absolute delivery surges 238%, price moves 5.09% in a single session and 10.83% across five. The delivery signal was in the bhav copy the evening it occurred. The price move came later. |
The sequence is exact and documented. The delivery signal in mid-June was not a prediction — it was a measurement. Shares were moving from accounts that intended to sell them into accounts that did not. Price had not moved because accumulation was not yet complete. When the second surge confirmed the same ownership shift at higher absolute levels, price followed with conviction.
Both signals were available to any retail participant who read the deliverable quantity column of the NSE bhav copy.
Source: MarketsMojo market data reports, Business Standard Capital Market News, NSE bhav copy disclosures. Dixon Technologies case study reflects documented NSE cash market data, June–July 2026.
The Practical Workflow: Reading the Third Variable Daily
Step 1 — After 6:30 PM IST Only
Running delivery screens intraday gives incomplete, misleading numbers. The bhav copy is final only after this time. Any screen run before market close is working with partial settlement data.
Step 2 — Build a 20-Day Absolute Baseline
For every stock on your watchlist, calculate the 20-day average of the absolute deliverable quantity — not the percentage. Any session where raw deliverable quantity exceeds 1.5 times this baseline warrants attention, regardless of what the percentage reads.
Step 3 — Look for the Quiet Divergence
Rising absolute delivery while price is flat, total traded volume is not elevated, and the stock is consolidating in a tight range. That combination is accumulation in its most legible form. The shares are moving. The price has not reflected it yet.
Step 4 — Require Three Consecutive Sessions Minimum
One elevated delivery session could be a block deal, an index rebalance, or a bulk cross. Three to five consecutive sessions of above-baseline absolute delivery in a consolidating stock is a structurally different signal — institutional loading occurring across multiple days to avoid moving price prematurely.
The Three-Variable Read
Price behaviour + traded volume trend + absolute delivery direction. When all three align — price beginning to move, traded volume confirming participation, absolute delivery confirming overnight ownership transfer — the signal has a structural foundation no two-variable analysis can replicate.
What This Gives You — and What It Does Not
Volume analysis is not a prediction engine. It is a conviction measurement. It tells you the degree of commitment behind a price move — not the direction the price will take next.
The four price-volume conversations describe market state. The six-tool stack translates them into signals, each with documented gaps. The three-variable framework closes the most significant gap available to Indian retail participants: the distinction between intraday noise and genuine overnight ownership transfer.
No global platform provides absolute delivery data at this granularity. No international screener pulls it. It sits in a publicly available file, published by NSE every evening, free of charge, accessible to any retail participant with the discipline to read the right column.
The traders extracting consistent edge from Indian equity markets are not using better charts. They are reading a data column that most participants do not know exists.
Data sourced from NSE bhav copy disclosures (nseindia.com), MarketsMojo market data reports (marketsmojo.com), Business Standard Capital Market News, SEBI intraday equity cash market study (FY2023), BottomStreet delivery volume analysis, and MarketNetra bhav copy research. Dixon Technologies case study reflects documented NSE cash market data, June–July 2026. This article is educational in nature and does not constitute investment advice. Independent verification is essential before any trading decision. I am not SEBI registered financial advisor.