

Overview
Technical Analysis helps us understand charts.
Fundamental Analysis helps us understand businesses whereas, Advance Market Analysis helps us understand the environment in which businesses and markets operate, It helps investors understand the broader forces that influence markets, industries, and investment decisions.
Market Analysis helps us understand the environment in which businesses and markets operate.
Markets are influenced by participants, economic conditions, business trends, investor psychology, liquidity, and expectations.
The objective of this section is not to predict markets.
The objective is to understand the forces that influence market behavior and investment decisions.
How Advance Market Analysis Fits with Other Analysis Types: Market Analysis works as a top-down filter for decision-making.
- Fundamental Analysis benefits from sector and macro context
- Technical Analysis gains confirmation from broader market trends
- Stock Analysis improves selection and timing
- Business Analysis becomes more relevant when industry tailwinds exist
📊 Why Advanced Market Analysis Matters Why “Advanced” Market Analysis?
Unlike stock or company analysis, this section focuses on the bigger picture — market trends, economic factors, investor behaviour, money flows, and market cycles. It is called “Advanced” because it helps investors understand the broader environment in which businesses and markets operate.
Lesson 1: Market Structure, Business Trends & Industry Trends
Market Analysis helps ensure decisions are made in the right market condition
.Lesson 1: Market Structure, Business Trends & Industry Trends
What You Will Learn
In this lesson, you will learn how markets function, why businesses and industries grow or decline, and how broader trends influence investment opportunities.
By the end of this lesson, you should be able to:
✔ Understand how market participants influence markets
✔ Identify business trends and industry trends
✔ Differentiate between cyclical and secular growth
✔ Understand why stock prices and business performance may differ
✔ Recognize different phases of market cycles
✔ Develop a broader perspective on market behavior
Introduction
What You Will Learn
Many investors spend most of their time studying stock prices, charts, financial statements, and company results.
While these are important, they only tell part of the story.
A company does not operate in isolation.
Its success depends on customers, competitors, industry conditions, economic policies, and investor expectations.
Similarly, stock prices do not move solely because of profits or losses.
Markets constantly react to changing expectations about the future.
To understand why some businesses thrive while others struggle, investors must look beyond individual stocks and understand the environment in which they operate.
This begins with understanding market structure, business trends, and industry trends.
📊 ADVANCED MARKET ANALYSIS
✅ Market Participants
(Retail • FII • DII)
✅ Business Trends
✅ Industry Trends
✅ Economic Policies
(RBI • Inflation • Rates)
✅ Market Sentiment
(Fear • Greed)
✅ Money Flow
(Accumulation • Distribution)
✅ Market Cycles
(Bull • Bear • Correction)
🎯 Outcome:
Better Investment Decisions
Understanding Market Structure
Every day, millions of investors buy and sell shares in the stock market.
Some invest for years.
Others trade for days, hours, or even minutes.
Each participant enters the market with different objectives, expectations, and levels of information.
The stock market functions as a meeting place where these different opinions interact.
When buyers are willing to pay higher prices, stocks rise.
When sellers become more aggressive, stocks fall.
Although this sounds simple, understanding who participates in the market helps explain many market movements.
Who Participates in Financial Markets?
Not all market participants have the same influence.
Retail Investors
Retail investors are individuals investing their own money.
They may be students, salaried employees, business owners, or long-term investors.
Retail participation has increased significantly due to online brokerages and greater financial awareness.
Institutional Investors
Institutions manage money on behalf of others.
Examples include:
- Mutual Funds
- Insurance Companies
- Pension Funds
- Asset Management Companies
Because institutions often manage large amounts of capital, their actions can significantly influence stock prices.
Foreign Institutional Investors (FIIs)
FIIs are international investors who invest in domestic markets.
Their investment decisions often affect:
- Large-cap stocks
- Market indices
- Overall market sentiment
Large inflows can support market rallies.
Large outflows can create market pressure.
Domestic Institutional Investors (DIIs)
DIIs are institutions investing within the domestic market.
Examples include:
- Mutual Funds
- Insurance Companies
- Pension Funds
In recent years, DIIs have become increasingly important participants in the Indian market.
Why Market Participants Matter
Imagine a retail investor buying ₹50,000 worth of shares.
The impact on the market is usually minimal.
Now imagine a large mutual fund investing ₹500 crore into the same stock.
The impact can be significant.
This is why understanding market participation helps investors understand market behavior.
Large market moves are often influenced by large pools of capital.
Understanding Business Trends
A company’s stock price may fluctuate every day.
However, the underlying business usually changes much more slowly.
Business trends represent the long-term direction of a company’s operations and performance.
Examples of positive business trends include:
- Revenue growth
- Profit growth
- Capacity expansion
- Market share gains
- Successful product launches
These developments often improve the long-term outlook of a business.
Why Business Trends Matter
Suppose two stocks are trading at the same price today.
One company is expanding capacity, increasing profits, and gaining market share.
The other is losing customers and facing declining demand.
Although both stocks may appear similar on the surface, their long-term prospects are very different.
Successful investors focus on understanding these underlying business trends rather than reacting solely to daily price movements.
Understanding Industry Trends
Businesses do not operate alone.
They are part of larger industries.
Industry trends often influence the opportunities available to individual companies.
Imagine two companies with equally competent management teams.
One operates in a rapidly growing industry.
The other operates in a declining industry.
Even if both companies execute well, the company in the growing industry often has a greater opportunity to increase revenue, improve profitability, and attract investor interest.
This is why industry trends are so important.
Examples of Industry Trends
Examples of long-term industry trends include:
Digitalization
Increasing adoption of technology, digital payments, cloud computing, and online services.
Healthcare Growth
Growing healthcare awareness, medical innovation, and rising healthcare spending.
Infrastructure Development
Government spending on roads, railways, ports, and urban development.
Defence Modernization
Increasing defence spending and focus on domestic manufacturing.
These trends often create opportunities for businesses operating within those industries.
Cyclical vs Secular Trends
One of the most important concepts in market analysis is understanding the difference between cyclical and secular trends.
Cyclical Trends
Cyclical industries are heavily influenced by economic conditions.
Their performance tends to improve during economic expansions and weaken during slowdowns.
Examples include:
- Real Estate
- Metals
- Commodities
- Automobiles
During periods of economic growth, demand increases and profits often improve.
During slowdowns, demand weakens and profitability may decline.
This cycle can repeat many times.
Secular Trends
Secular trends are long-term structural trends that may continue for many years.
Their growth is driven by fundamental changes in society, technology, or consumer behavior.
Examples include:
- Digital Payments
- Technology Adoption
- Healthcare Innovation
- Financial Inclusion
Unlike cyclical trends, secular growth often continues despite short-term economic fluctuations.
Why Stock Prices and Businesses May Move Differently
One of the most confusing aspects of investing is that stock prices and business performance do not always move together.
Many beginners assume:
Good results = Stock rises
Bad results = Stock falls
In reality, markets are more complicated.
Strong Business, Weak Stock
A company may report record profits.
Yet the stock falls.
Why?
Because investors were expecting even stronger results.
The business may be performing well, but expectations were higher.
Weak Business, Strong Stock
A company may report average results.
Yet the stock rises.
Why?
Because investors expect future improvement.
Markets often react to changing expectations rather than current performance alone.
Understanding this concept helps investors avoid confusion during earnings seasons and market corrections.
Understanding Market Cycles
Markets rarely move in straight lines.
Instead, they move through cycles.
Although every cycle is unique, certain patterns frequently repeat.
Pessimism
Economic conditions are weak.
Investor confidence is low.
Negative news dominates headlines.
Expectations become very low.
Recovery
Conditions begin improving.
Business performance stabilizes.
Investors slowly regain confidence.
Optimism
Economic activity improves.
Corporate earnings grow.
Investor participation increases.
Markets often perform strongly during this phase.
Euphoria
Confidence becomes excessive.
Many investors begin believing markets can only move higher.
Speculation increases.
Risk is often underestimated.
Correction
Reality eventually catches up with expectations.
Profit booking increases.
Markets correct and the cycle begins again.
Understanding market cycles helps investors maintain perspective and avoid emotional decision-making.
Looking Beyond Daily Noise
Daily market movements often attract the most attention.
However, long-term investors benefit more from understanding:
- Business trends
- Industry trends
- Economic conditions
- Market cycles
- Investor behavior
These factors often have a much greater impact on long-term investment outcomes than short-term price fluctuations.
Key Takeaway
Markets are influenced by people, businesses, industries, economic conditions, and expectations.
Understanding market structure helps investors understand who influences markets.
Understanding business and industry trends helps identify opportunities and risks.
Understanding market cycles helps investors maintain perspective during both optimism and uncertainty.
Successful investors focus not only on what is happening today but also on the broader forces shaping the future.
In the next lesson, we will explore Market Observation & Market Behaviour and learn how investors interpret price action, volume, participation, and market activity to understand what the market may be communicating.
Lesson 2: Market Observation & Market Behaviour
What You Will Learn
In this lesson, you will learn how investors observe markets and interpret market behaviour through price movement, volume, participation, and sentiment.
By the end of this lesson, you should be able to:
✔ Observe market behaviour more effectively
✔ Understand what price and volume may be communicating
✔ Recognize strength and weakness in markets
✔ Understand market participation and sentiment
✔ Develop a more objective view of market activity
Introduction
One of the biggest mistakes investors make is trying to predict every market move.
Successful investors often spend less time predicting and more time observing.
The market constantly provides information.
Every price movement, volume surge, breakout, correction, and trend reflects the collective decisions of thousands or even millions of participants.
The challenge is not finding information.
The challenge is learning how to interpret it.
Market observation is the process of studying what the market is doing rather than what we think it should do.
The Market Is Always Communicating
Imagine entering a crowded room.
Without speaking to anyone, you can often sense whether people are excited, nervous, confident, or uncomfortable.
Markets behave similarly.
They communicate through:
- Price
- Volume
- Participation
- Volatility
- Sentiment
The market may not tell us exactly what will happen next, but it often provides clues about the balance between demand and supply.
Learning to recognize these clues is an important skill.
Observing Price Behaviour
Price is the most direct expression of market opinion.
Every transaction occurs because a buyer and seller agree on a price.
When buyers become more aggressive than sellers, prices rise.
When sellers become more aggressive than buyers, prices fall.
This sounds simple, but price behaviour often reveals information before news headlines appear.
For example, a stock that continues making higher highs and higher lows is often communicating strength.
A stock that repeatedly fails to hold gains may be communicating weakness.
Investors should learn to observe price behaviour before searching for explanations.
Observing Volume Behaviour
Price tells us what happened.
Volume helps explain how much participation was involved.
Imagine two stocks rising by 5%.
The first rises on low volume.
The second rises on significantly higher volume.
The second move may carry more significance because more participants were involved.
Volume often helps investors evaluate conviction.
Strong moves supported by strong volume generally attract more attention than moves occurring on weak participation.
Market Participation
Not all rallies and declines are equal.
Sometimes a market advance is supported by broad participation.
Many stocks rise together.
Confidence spreads across sectors and industries.
At other times, only a small number of stocks drive market gains while many others struggle.
This difference matters.
Healthy market participation often reflects stronger underlying conditions.
Weak participation may suggest caution.
Strength and Weakness
One of the most useful observations investors can make is identifying relative strength and weakness.
Imagine the overall market falls 5%.
Most stocks decline sharply.
However, a few stocks remain stable or fall only slightly.
These stocks may be demonstrating relative strength.
Similarly, if the market rises strongly while a stock struggles to participate, it may indicate relative weakness.
Strong stocks often attract attention before trends become obvious.
Weak stocks often reveal problems before negative news appears.
Understanding Volatility
Volatility refers to the speed and magnitude of price movement.
Some periods are calm.
Others are highly emotional.
During periods of high uncertainty, markets often experience larger price swings.
Many beginners view volatility as a problem.
Experienced investors often view it as information.
Increasing volatility may indicate:
- Uncertainty
- Changing expectations
- Rising emotional participation
Observing volatility helps investors better understand market conditions.
Market Sentiment
Markets are influenced not only by facts but also by emotions.
Fear and greed often play an important role in short-term price movements.
When optimism becomes widespread, investors may become willing to pay increasingly higher prices.
When fear dominates, investors may become willing to sell even strong businesses.
Neither extreme lasts forever.
Understanding sentiment helps investors recognize when emotions may be influencing market behaviour.
Observation vs Prediction
One of the most valuable habits investors can develop is distinguishing observation from prediction.
Prediction asks:
What will happen next?
Observation asks:
What is happening right now?
Predictions are uncertain.
Observations are based on available evidence.
Investors who focus on observation often make more objective decisions because they respond to information rather than assumptions.
Common Observation Mistakes
Many investors unknowingly allow emotions to influence their observations.
Common mistakes include:
Looking Only for Information That Supports Existing Opinions
When investors become emotionally attached to an idea, they often ignore contradictory evidence.
Focusing Only on News
News explains some market movements but not all.
Markets frequently react before information becomes widely understood.
Ignoring Volume
Price alone does not always tell the complete story.
Participation often matters.
Confusing Volatility with Trend
A volatile market is not necessarily a bullish or bearish market.
Volatility and direction are different concepts.
Developing Better Market Observation Skills
Good market observation requires:
- Patience
- Curiosity
- Objectivity
- Consistency
Instead of asking:
Which stock should I buy?
A better question is:
What is the market currently communicating?
The quality of observation often influences the quality of decision-making.
Key Takeaway
Markets communicate through price, volume, participation, volatility, and sentiment.
Successful investors spend less time predicting and more time observing.
The objective of market observation is not to forecast every move.
The objective is to understand the information the market is already providing and use that information to make more informed decisions.
In the next lesson, we will explore the fundamental and technical factors that can change a stock’s trend and influence future market behaviour.
Lesson 3: Factors That Change Fundamental & Technical Trends
What You Will Learn
In this lesson, you will learn the key factors that can change a stock’s direction and influence both its fundamental and technical trend.
By the end of this lesson, you should be able to:
✔ Identify factors that strengthen a trend
✔ Recognize factors that weaken a trend
✔ Understand the connection between fundamentals and technicals
✔ Understand why trends change over time
Introduction
A stock does not move from ₹100 to ₹500 by accident.
Similarly, a stock does not fall from ₹500 to ₹100 without a reason.
Behind every major trend, there is usually a change in business performance, investor expectations, market sentiment, or liquidity.
Technical charts often show the change.
Fundamentals often explain the reason behind the change.
Understanding both helps investors identify trends more effectively.
Fundamental Factors That Change Trends
Fundamental trends change when investors begin viewing a company’s future differently.
This usually happens because the business itself is changing.
Revenue Growth
Consistent revenue growth often indicates increasing demand for a company’s products or services.
As confidence in future growth improves, investor interest often increases.
Profit Growth
Growing profits indicate that the company is converting business activity into shareholder value.
Sustained profit growth often attracts long-term investors.
Margin Expansion
A company earning more profit from the same revenue becomes more efficient and valuable.
Improving margins often strengthen investor confidence.
Capacity Expansion
When a company increases production capacity, investors begin evaluating future growth potential rather than current earnings alone.
Order Book Growth
For sectors such as defence, engineering, and infrastructure, a growing order book often improves future revenue visibility.
Market Share Gains
A company that consistently captures market share from competitors may indicate increasing competitive strength.
Future Guidance
Markets are forward-looking.
Strong future guidance can sometimes move a stock more than strong current results.
Investors care not only about what happened, but also about what may happen next.
Technical Factors That Change Trends
While fundamentals influence long-term direction, technical factors often influence how trends develop and unfold.
Breakouts
When a stock breaks above a major resistance level, it often signals increasing demand.
Breakouts frequently attract new participants and improve sentiment.
Breakdowns
When support levels fail, selling pressure often increases.
Breakdowns can signal weakening confidence.
Volume Expansion
Volume represents participation.
A trend supported by increasing volume often carries greater conviction than a trend developing on weak volume.
Trend Reversals
Every trend eventually changes.
Higher highs may become lower highs.
Strong uptrends may weaken.
Downtrends may stabilize.
Recognizing these transitions is an important part of market observation.
Sentiment Can Change Trends
Sometimes nothing changes inside the business.
Yet the stock moves significantly.
Why?
Because expectations change.
Markets are influenced by:
- Optimism
- Fear
- Confidence
- Uncertainty
Changes in sentiment can strengthen or weaken trends even before financial results reflect those changes.
The Connection Between Fundamentals and Technicals
Many investors treat fundamental and technical analysis as separate subjects.
In reality, they often interact.
Fundamentals explain why a trend may develop.
Technicals help show how the market is responding to that information.
For example:
A company announces strong earnings, capacity expansion, and positive guidance.
Fundamental outlook improves.
Investors begin buying.
Demand increases.
Volume expands.
The stock breaks resistance.
A technical trend develops.
The fundamental change started the process.
The technical trend reflected market participation.
Key Takeaway
Major stock trends rarely change without a reason.
Revenue growth, profit growth, margins, capacity expansion, order books, market share gains, and future guidance can influence fundamental trends.
Breakouts, breakdowns, volume expansion, and trend reversals can influence technical trends.
Successful investors understand that fundamentals and technicals often tell different parts of the same story.
In the next lesson, we will explore Economic Policies and understand how interest rates, inflation, government actions, and liquidity influence businesses, investors, and markets.
Lesson 4: Economic Policies & Their Impact on Markets
What You Will Learn
In this lesson, you will learn how economic policies influence businesses, investors, and financial markets.
By the end of this lesson, you should be able to:
✔ Understand the role of economic policy
✔ Understand inflation and interest rates
✔ Learn the difference between fiscal and monetary policy
✔ Understand liquidity and market behaviour
✔ Recognize how policy changes can influence stock trends
Introduction
Many investors focus only on individual companies.
However, even the strongest businesses operate within a larger economic environment.
Interest rates, inflation, government spending, taxation, liquidity, and central bank decisions influence businesses every day.
These factors affect:
- Consumer spending
- Business expansion
- Borrowing costs
- Corporate profits
- Investor sentiment
This is why understanding economic policies helps investors better understand market behaviour.
Why Economic Policies Matter
Imagine a company planning to build a new manufacturing plant.
To finance the project, it may need loans.
Now imagine interest rates suddenly rise significantly.
Borrowing becomes more expensive.
Expansion plans may slow.
Future profits may be affected.
Nothing changed about the company’s products.
Nothing changed about management.
Yet an economic factor changed the business environment.
This demonstrates why investors must understand economic policies.
Inflation
Inflation refers to the general increase in prices over time.
As inflation rises:
- Goods become more expensive
- Services become more expensive
- Purchasing power declines
For consumers, inflation increases the cost of living.
For businesses, inflation may increase:
- Raw material costs
- Employee costs
- Transportation expenses
How Inflation Impacts Markets
Moderate inflation is generally considered normal in a growing economy.
However, excessively high inflation can create challenges.
Businesses may struggle to maintain profit margins.
Consumers may reduce spending.
Investor uncertainty may increase.
As a result, markets often pay close attention to inflation trends.
Interest Rates
Interest rates represent the cost of borrowing money.
They influence:
- Businesses
- Consumers
- Banks
- Investors
When borrowing becomes cheaper, spending and investment often increase.
When borrowing becomes expensive, economic activity may slow.
Why Markets Watch Interest Rates
Interest rates influence almost every part of the economy.
Lower Interest Rates
Often encourage:
- Business expansion
- Consumer spending
- Home purchases
- Investment activity
Higher Interest Rates
Often lead to:
- Reduced borrowing
- Slower spending
- Lower business expansion
- Greater caution among investors
This is why interest rate decisions frequently influence market sentiment.
Monetary Policy
Monetary Policy refers to actions taken by a central bank to influence economic activity.
In India, this role is performed by the Reserve Bank of India (RBI).
The RBI uses tools such as:
- Interest rates
- Liquidity management
- Money supply measures
The objective is generally to balance:
- Economic growth
- Inflation control
- Financial stability
Fiscal Policy
Fiscal Policy refers to government decisions regarding:
- Spending
- Taxation
- Budget allocation
Governments may increase spending to support economic growth or reduce spending to control fiscal pressures.
Examples include:
- Infrastructure projects
- Welfare programs
- Tax incentives
- Industry support schemes
Fiscal policy can influence business opportunities across many sectors.
Liquidity
Liquidity refers to the availability of money within the financial system.
When liquidity is abundant:
- Borrowing becomes easier
- Investment activity often increases
- Risk-taking may rise
When liquidity tightens:
- Capital becomes harder to access
- Investors become more selective
- Market participation may slow
Why Liquidity Matters
Imagine a garden.
Even healthy plants require water to grow.
Similarly, markets require liquidity.
Strong liquidity often supports market activity.
Weak liquidity often creates caution and volatility.
Liquidity does not determine business quality, but it can influence investor behaviour and market trends.
Currency Movements
Currencies influence international trade and business profitability.
For example:
A weaker domestic currency may help exporters.
A stronger domestic currency may benefit importers.
Many businesses are directly affected by currency fluctuations.
This is one reason investors monitor exchange-rate movements.
Government Policies & Business Impact
Government decisions can create opportunities and risks.
Examples include:
Positive Impact
- Infrastructure spending
- Manufacturing incentives
- Tax reforms
- Industry support programs
Potential Challenges
- Regulatory restrictions
- Higher taxes
- Compliance costs
- Policy uncertainty
Because of this, investors often evaluate how government policies may affect future business performance.
Economic Policies & Stock Prices
One of the most important lessons investors learn is that markets are forward-looking.
Markets do not simply react to current conditions.
They react to expectations.
If investors believe economic policies will improve future growth, markets may respond positively.
If investors expect policies to slow growth, sentiment may weaken.
This is why stock prices sometimes move long before economic changes become visible in company results.
Common Mistakes Investors Make
Ignoring the Economic Environment
Even strong companies operate within broader economic conditions.
Overreacting to Every Policy Announcement
Not every policy change creates a lasting impact.
Long-term effects matter more than headlines.
Assuming One Policy Affects All Companies Equally
Different businesses respond differently to economic changes.
Focusing Only on Short-Term Market Reactions
Markets often react immediately.
Business impact may take months or years to become visible.
Key Takeaway
Economic policies influence businesses, consumers, investors, and financial markets.
Inflation, interest rates, fiscal policy, monetary policy, liquidity, and government decisions all contribute to shaping the investment environment.
Understanding these factors helps investors better interpret market behaviour and evaluate how external conditions may influence future opportunities and risks.
In the next lesson, we will explore Market Sentiment, Bull Markets, Bear Markets, and Volatility to understand how psychology and emotions influence market behaviour.
Lesson 5: Market Sentiment, Bull Markets, Bear Markets & Volatility
What You Will Learn
In this lesson, you will learn how investor psychology influences market behaviour and why markets often move beyond pure logic in the short term.
Introduction
Markets are driven by numbers, but they are also driven by people.
People experience:
- Optimism
- Fear
- Confidence
- Uncertainty
- Greed
Because of this, stock prices often move not only based on business performance but also on investor sentiment.
Understanding market sentiment helps investors avoid becoming overly emotional during periods of extreme optimism or fear.
What Is Market Sentiment?
Market sentiment refers to the overall mood or attitude of investors toward the market.
Sometimes investors become optimistic and expect growth.
At other times they become cautious and focus on risks.
Sentiment often influences market behaviour before business results change.
Bull Markets
A Bull Market is a period when stock prices trend higher over an extended period.
Characteristics:
- Strong investor confidence
- Increasing participation
- Positive economic outlook
- Rising stock prices
Bull markets often create optimism and encourage investors to take greater risks.
Bear Markets
A Bear Market is a period when stock prices trend lower over an extended period.
Characteristics:
- Weak sentiment
- Increased uncertainty
- Negative outlook
- Falling stock prices
Bear markets often create fear and cause investors to become more defensive.
Understanding Volatility
Volatility refers to the speed and magnitude of price movements.
High volatility means prices move sharply in either direction.
Low volatility means price movements are relatively stable.
Volatility itself is not bullish or bearish.
It simply reflects uncertainty and changing expectations.
Fear and Greed
Two emotions often dominate markets:
Greed
Investors become overly optimistic.
Risk is often underestimated.
Many participants believe prices can only move higher.
Fear
Investors become overly cautious.
Even good opportunities may be ignored.
Risk becomes the primary focus.
Successful investors learn to recognize both extremes without becoming controlled by them.
Why Sentiment Matters
Markets frequently move ahead of reality.
When investors expect improvement, prices may rise before results improve.
When investors expect problems, prices may fall before those problems appear in financial statements.
Understanding sentiment helps investors understand why markets sometimes react differently than expected.
Key Takeaway
Bull markets, bear markets, volatility, fear, and greed are natural parts of investing.
While fundamentals drive long-term value, sentiment often drives short-term market behaviour.
Investors who understand market psychology are often better prepared to remain rational when emotions dominate the market.
In the next lesson, we will compare Long-Term Investing, Positional Trading, and Swing Trading to understand different approaches to participating in the market.
Market Analysis – Practical Insights
Below are practical Market Analysis topics covered on Samnidhi Insights.
Market Trends & Cycles
- Bull and bear market phases
- Market cycle stages
- Risk-on and risk-off environments
Index-Level Analysis
- Nifty 50 trend behaviour
- Bank Nifty and financial sector signals
- Midcap and smallcap cycles
Sector & Industry Analysis
- Sector rotation patterns
- Cyclical vs defensive sectors
- Policy-driven sector movements
Macro & Policy Analysis
- RBI policy impact on markets
- Interest rate cycles
- Inflation and growth signals
Market Sentiment & Flows
- FII and DII flow analysis
- Volatility trends
- Sentiment extremes and reversals
Why Market Analysis Matters
Market Analysis helps investors avoid a common mistake — making good decisions in bad market conditions.
By understanding the broader environment, investors can:
- Improve timing
- Manage risk better
- Align strategies with market reality
Lesson 6: Long-Term Investing, Positional Trading & Swing Trading
What You Will Learn
In this lesson, you will learn the differences between Long-Term Investing, Positional Trading, and Swing Trading, along with the advantages and limitations of each approach.
Introduction
One of the most common questions in the market is:
Should I invest or trade?
The answer depends on your goals, time horizon, personality, risk tolerance, and level of involvement.
There is no universally superior approach.
Each style requires a different mindset and skill set.
Understanding these differences helps investors choose an approach that aligns with their objectives rather than following what others are doing.
Long-Term Investing
Long-term investing focuses on owning businesses for years rather than reacting to short-term price movements.
The primary objective is to benefit from:
- Business growth
- Earnings growth
- Compounding
- Value creation over time
Long-term investors spend more time studying:
- Business quality
- Financial statements
- Management
- Industry trends
- Valuation
than daily market fluctuations.
Advantages
- Lower transaction costs
- Less emotional stress
- Benefits from compounding
- Greater focus on business fundamentals
Challenges
- Requires patience
- Temporary market declines must be tolerated
- Results may take years to materialize
Positional Trading
Positional trading sits between investing and short-term trading.
Positions are typically held for weeks or months.
The objective is to participate in medium-term market trends rather than long-term business growth.
Positional traders often focus on:
- Trend direction
- Breakouts
- Volume confirmation
- Market sentiment
- Risk management
Advantages
- Captures meaningful trends
- Requires less monitoring than active trading
- Provides flexibility
Challenges
- Trends may reverse unexpectedly
- Requires discipline and patience
- Market timing becomes more important
Swing Trading
Swing trading focuses on capturing shorter-term price movements.
Trades may last from a few days to several weeks.
The objective is to benefit from market swings rather than long-term business development.
Swing traders typically rely more on:
- Technical analysis
- Price action
- Volume
- Momentum
- Risk management
Advantages
- Frequent opportunities
- Faster feedback
- Less dependence on long-term business outcomes
Challenges
- Requires active monitoring
- Higher emotional pressure
- Greater influence from short-term market noise
Which Approach Is Best?
There is no perfect approach.
A person’s success often depends more on consistency and discipline than on the method itself.
Long-Term Investing
Best suited for those who enjoy studying businesses and prefer wealth creation through compounding.
Positional Trading
Best suited for those who want to participate in market trends without becoming full-time traders.
Swing Trading
Best suited for those who enjoy active market participation and can manage risk consistently.
The Common Requirement
Regardless of the approach chosen, certain principles remain important:
- Risk Management
- Patience
- Discipline
- Continuous Learning
- Emotional Control
These qualities often determine success more than any strategy or indicator.
Key Takeaway
Long-Term Investing, Positional Trading, and Swing Trading are different ways of participating in the market.
Each approach has its own objectives, advantages, risks, and time horizons.
The goal is not to find the “best” approach.
The goal is to identify the approach that matches your personality, available time, knowledge, and investment objectives.
In the next lesson, we will explore Smart Money Flow, Accumulation, Distribution, and Market Cycles to understand how large market participants influence trends and market behaviour.
Lesson 7: Smart Money Flow, Accumulation, Distribution & Market Cycles
What You Will Learn
In this lesson, you will learn how large market participants influence trends, how accumulation and distribution occur, and why markets move through recurring cycles.
Introduction
Many investors focus only on stock prices.
However, behind every major trend are market participants making decisions.
Some participants invest a few thousand rupees.
Others manage hundreds or thousands of crores.
Because institutions control large pools of capital, their buying and selling activity can influence market trends significantly.
Understanding how large participants enter and exit positions helps investors better understand market behaviour.
What Is Smart Money?
The term “Smart Money” generally refers to large and informed market participants.
Examples include:
- Mutual Funds
- Insurance Companies
- Pension Funds
- Foreign Institutional Investors (FIIs)
- Domestic Institutional Investors (DIIs)
This does not mean institutions are always correct.
However, their actions often influence market trends because of the size of their capital.
Why Institutions Cannot Buy Like Retail Investors
Imagine a retail investor purchasing ₹50,000 worth of shares.
The transaction is completed almost instantly.
Now imagine a large institution attempting to buy ₹500 crore worth of the same stock.
Buying everything at once could push prices sharply higher.
For this reason, institutions often build positions gradually.
This gradual process creates accumulation.
Similarly, when exiting large positions, institutions often sell gradually.
This creates distribution.
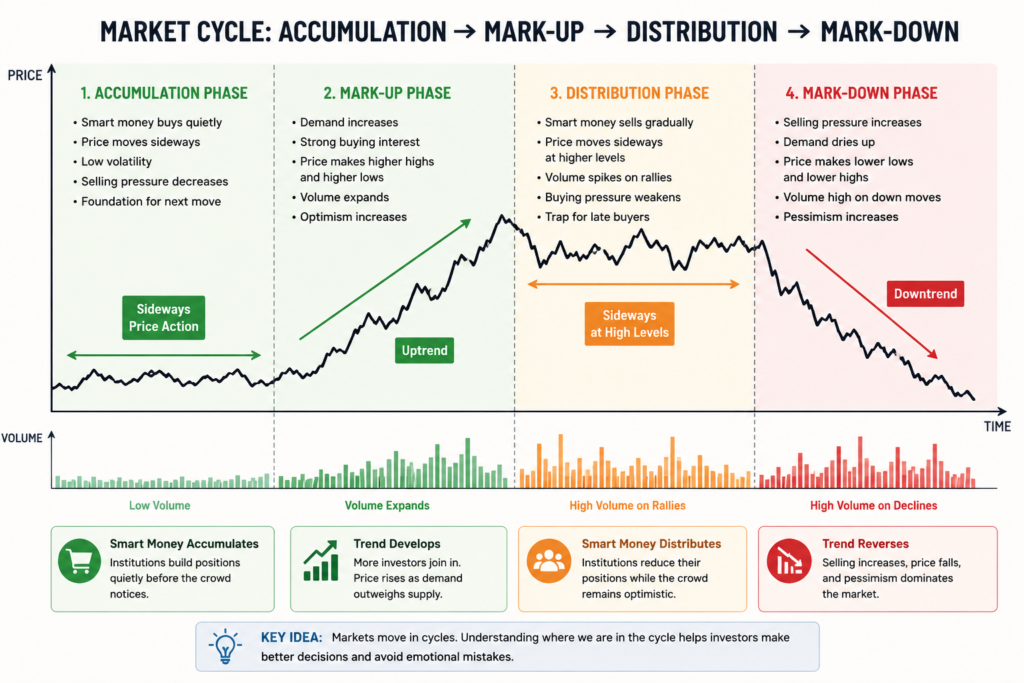
Accumulation
Accumulation occurs when large participants gradually build positions over time.
During accumulation:
- Price may move slowly
- Volatility may reduce
- Sharp declines are often absorbed
- Volume may quietly increase
To most investors, the stock may appear inactive.
However, beneath the surface, ownership may be changing hands.
Accumulation often occurs before major trends develop, although not every accumulation phase leads to a strong rally.
Distribution
Distribution is the opposite of accumulation.
It occurs when large participants gradually reduce or exit positions.
During distribution:
- Price may stop making meaningful progress
- Selling pressure gradually increases
- Strong rallies may fail to sustain themselves
- Volatility may increase
Many investors remain optimistic because prices have not yet declined significantly.
However, underlying demand may be weakening.
Distribution often occurs near the later stages of strong advances.
Why Volume Matters
Price shows what happened.
Volume helps reveal participation.
A breakout supported by strong volume often attracts more attention because it suggests greater market participation.
Similarly, unusual volume activity may indicate that larger participants are becoming active.
Volume does not guarantee future direction, but it often provides useful context.
Following Money Flow
Markets ultimately move because money flows into and out of assets.
When institutional participation increases:
- Demand may increase
- Liquidity may improve
- Trends may strengthen
When large participants become cautious:
- Demand may weaken
- Volatility may increase
- Trends may slow
Understanding money flow helps investors focus on market participation rather than opinions alone.
Understanding Market Cycles
Markets rarely move in a straight line forever.
Instead, they move through recurring cycles.
Although every cycle differs, certain patterns appear repeatedly.
Accumulation Phase
Sentiment is often weak.
Many investors remain cautious.
Institutional participation may gradually increase.
Prices often move sideways.
Mark-Up Phase
Demand begins exceeding supply.
Confidence improves.
Prices start trending higher.
Investor participation increases.
This is often where the strongest trends develop.
Distribution Phase
Optimism becomes widespread.
Prices continue rising, but momentum may begin slowing.
Institutions may gradually reduce exposure.
Many investors remain highly confident.
Mark-Down Phase
Selling pressure increases.
Confidence weakens.
Prices decline.
Market participants become increasingly defensive.
Eventually the cycle begins again.
Why Understanding Cycles Matters
Many investors become most optimistic near market highs and most pessimistic near market lows.
This is often the opposite of what successful investors attempt to do.
Understanding market cycles helps investors:
- Maintain perspective
- Avoid emotional decisions
- Recognize changing market conditions
- Improve risk awareness
The goal is not to predict every cycle perfectly.
The goal is to understand where the market may currently be positioned.
Common Mistakes Investors Make
Assuming Institutions Always Know More
Large investors make mistakes too.
Their activity should be observed, not blindly followed.
Treating Every Sideways Market as Accumulation
Not every consolidation leads to a major rally.
Ignoring Distribution Signs
Many investors focus only on buying opportunities and overlook warning signs.
Expecting Cycles to Repeat Exactly
Every market cycle is different.
History often rhymes, but it rarely repeats perfectly.
Key Takeaway
Large market participants can significantly influence trends through their buying and selling activity.
Accumulation and distribution represent the gradual transfer of ownership that often occurs before major market moves.
Understanding money flow, volume, participation, and market cycles helps investors better interpret market behaviour and maintain perspective during both optimism and uncertainty.
The objective is not to predict every market move.
The objective is to understand how capital flows through markets and how those flows influence long-term trends.
This concludes the Advanced Market Analysis section.
Conclusion
Advanced Market Analysis complements Fundamental Analysis, Technical Analysis, Stock Analysis, and Business Analysis by providing a broader market perspective. Markets are influenced by far more than stock prices alone.
Throughout this section, we explored how market participants, business trends, industry trends, economic policies, investor psychology, money flow, and market cycles shape market behaviour.
Understanding markets is not about predicting every rise and fall.
It is about understanding the forces that influence those movements.
Successful investors learn to observe rather than react, analyze rather than speculate, and focus on trends rather than daily noise.
The market will always experience periods of optimism, pessimism, opportunity, and uncertainty.
However, investors who understand how markets function are often better prepared to navigate these changing conditions.
The objective of this section was not to provide certainty about the future.
The objective was to build awareness of the factors that influence businesses, stock prices, and investment decisions.
Because in the long run, successful investing is rarely about knowing what will happen tomorrow.
It is about understanding what is happening today and being prepared for what may happen next.
Market indices, sector performance, and institutional activity can be monitored through the National Stock Exchange (NSE).
Explore next Advance Market Analysis